Author
 Andrew Mutch
Having previously worked as an aircraft technician with HM Forces, Andy is one of our Professional Services Consultants and has been with EPLAN for 10 years. Part of Andy's role is to actively analyse customers processes, develop solution concepts and workflows for customer requirements. Andy is also our resident Harness expert!
Mutch.a@eplan.co.uk
Andrew Mutch auf LinkedIn
Andrew Mutch
Having previously worked as an aircraft technician with HM Forces, Andy is one of our Professional Services Consultants and has been with EPLAN for 10 years. Part of Andy's role is to actively analyse customers processes, develop solution concepts and workflows for customer requirements. Andy is also our resident Harness expert!
Mutch.a@eplan.co.uk
Andrew Mutch auf LinkedIn
Static, Dynamic and Conditional Forms – Do you Know the Difference?
Static Forms
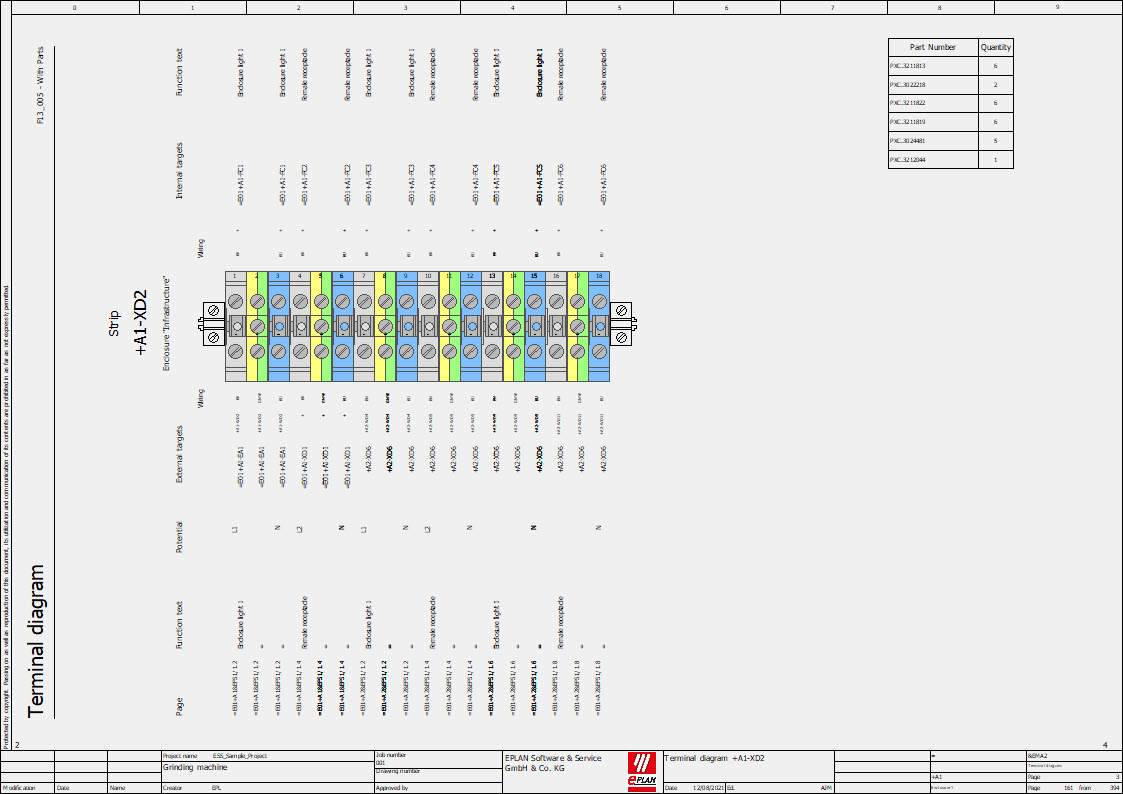
Static forms show reported data such as terminal diagrams or wiring diagrams individually on separate pages. The data is presented in a table with a constant row height, meaning that all graphics are the same on every report. Even if there is no data entry, all rows will still appear. For example, if a terminal rail only needs 10 terminals, the static form will show 10 entries, leaving the rest of the form unused.
.png?width=1123&name=MicrosoftTeams-image%20(6).png) A terminal diagram as a static form report.
A terminal diagram as a static form report.
Dynamic Forms
In comparison to static forms, it is possible to insert so-called ‘dynamic areas’ into dynamic forms so that they can be adapted to suit the needs of the individual using them. The row height can be varied by activating the 'Adapt row height dynamically' form property, meaning that the more information is inputted, the bigger the form.
.png?width=1123&name=MicrosoftTeams-image%20(5).png) The same terminal diagram in a dynamic form report.
The same terminal diagram in a dynamic form report.
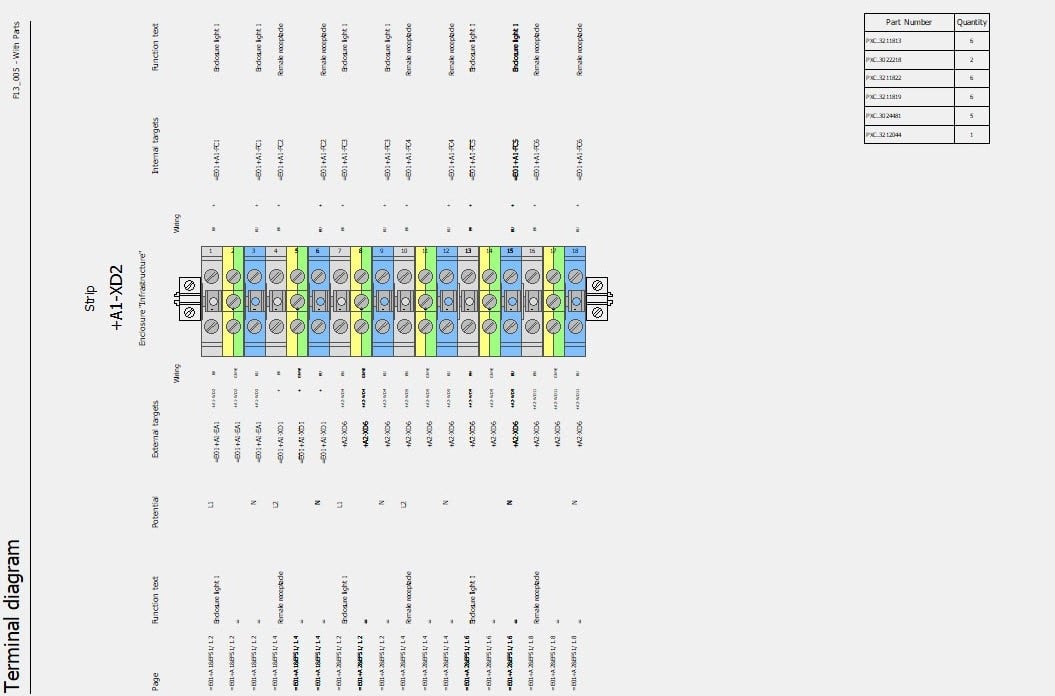
We recognise how large projects and project documentation can become. Dynamic forms can be useful to condense projects by maximising on the number of pages used within a project, improving your business's electrical design workflow optimisation. Unlike static forms,you can combine reports from several functions on one report page, such as all the connections. The image below shows the terminal diagram and the number of parts on one page.

Utilising the page space by adding the number of parts to the terminal diagram using dynamic forms.
Conditional Forms
Dynamic forms in EPLAN offer enhanced functionality through the creation of 'subforms' that can be linked to specific conditions. This feature allows for more intuitive information retrieval and improved readability. For instance, you can set up a condition to highlight safety-related parts in yellow, resulting in a 'main form' and a 'conditional form' of the same type.
Conditional forms can be created for most function-specific reports by defining a function filter. However, this capability is not available for certain connection point diagrams, such as device-connection, cable-connection, and terminal-connection diagrams. This conditional formatting enables users to quickly identify and focus on specific components or attributes within complex reports, streamlining the design and review process.
Project Filters in Reports
Different stakeholders in a project often require varying levels of detail in their documentation. For instance, the shop floor or commissioning team might need a more comprehensive terminal diagram compared to the client.Frequently, individuals benefit from a combination of different form types. EPLAN's project filters streamline the process of generating tailored documentation for specific stakeholders. These filters act as rules during report generation, automatically selecting the appropriate forms based on predefined project properties.
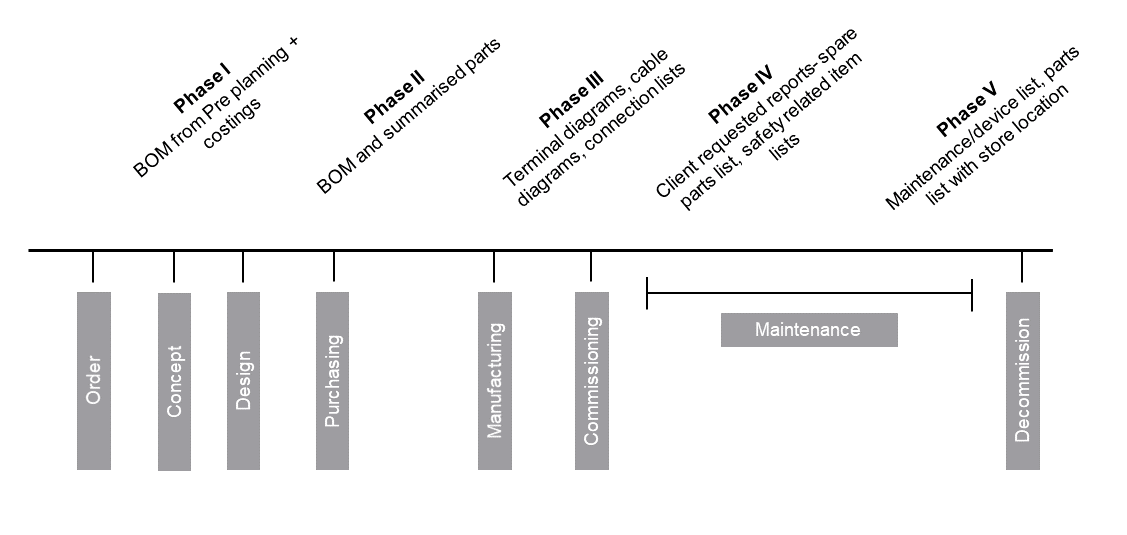
EPLAN users generate reports at the project's conclusion to provide manufacturing with a complete document set. However, a more strategic approach involves using project filters at key phases of the project lifecycle. Consistent project lifecycle documentation allows for timely production of specific reports when they're most valuable. For example, generating a bill of materials earlier in the process enables the procurement of long-lead items, potentially reducing overall project timelines. By making use of project filters throughout, teams can access critical information whenever necessary.
 An example of five phases in the project's lifecycle where reports could be generated.


Comments